
CXMT pre-IPO price discovery on Hyperliquid
Zheng Jie Lim · Artemis · Data as of
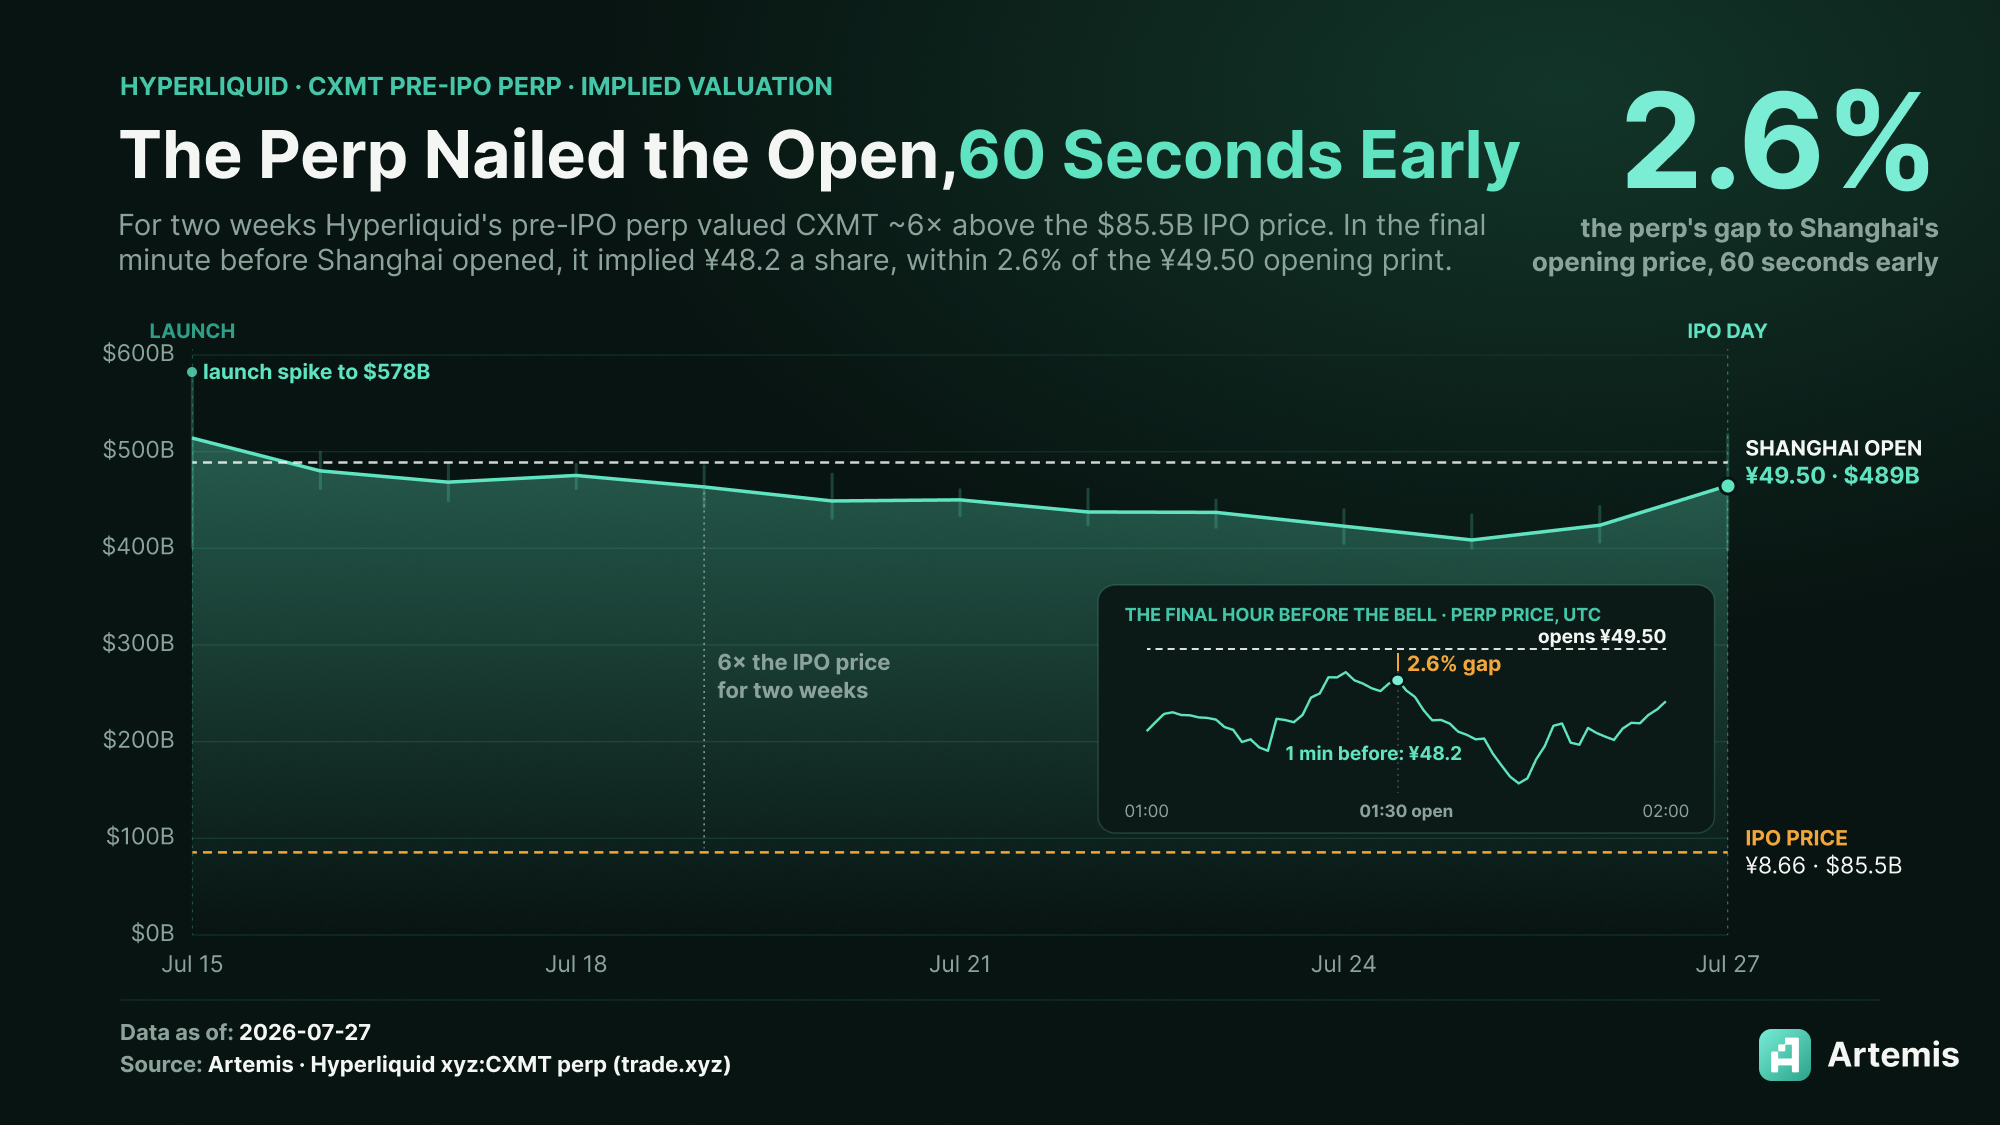
This July 2026 case study compares the CXMT pre-IPO perpetual on Hyperliquid with the opening share price in Shanghai. The main chart follows implied valuation before the opening bell; the inset isolates the final hour.
What the 2.6% measures
The graphic reports an implied share price of ¥48.2 one minute before the open, against an opening print of ¥49.50. The absolute gap divided by the opening price is (49.50 − 48.20) ÷ 49.50 × 100, or approximately 2.6%.
The comparison uses the opening trade as its benchmark. The ¥8.66 IPO offer price is a separate reference: it answers a different question from where shares first traded publicly. Keeping both benchmarks visible is central to reading the chart.
Market context
Trade.xyz’s pre-IPO perpetual documentation explains that these instruments are cash-settled derivatives. Holding one does not confer shares or an IPO allocation. Prices before listing reflect trading in that derivative market.
The close match in this example is an observation about one event, not evidence that pre-IPO perpetuals consistently predict opening prices. Liquidity, the chosen observation time, currency conversion and the share-count assumption all matter when turning a contract price into an implied valuation.
The historical series and July 27, 2026 comparison are credited to Artemis and the Hyperliquid xyz:CXMT market on Trade.xyz. The current documentation explains the instrument; it is not an archive of the plotted trades.
Related: comparing revenue per employee across crypto and technology companies.
View the original infographic · More writing
Notes reviewed .
© 2026 Zheng Jie Lim. All rights reserved. Image use.