
Where x402 payments settle
Zheng Jie Lim · Artemis · Data as of
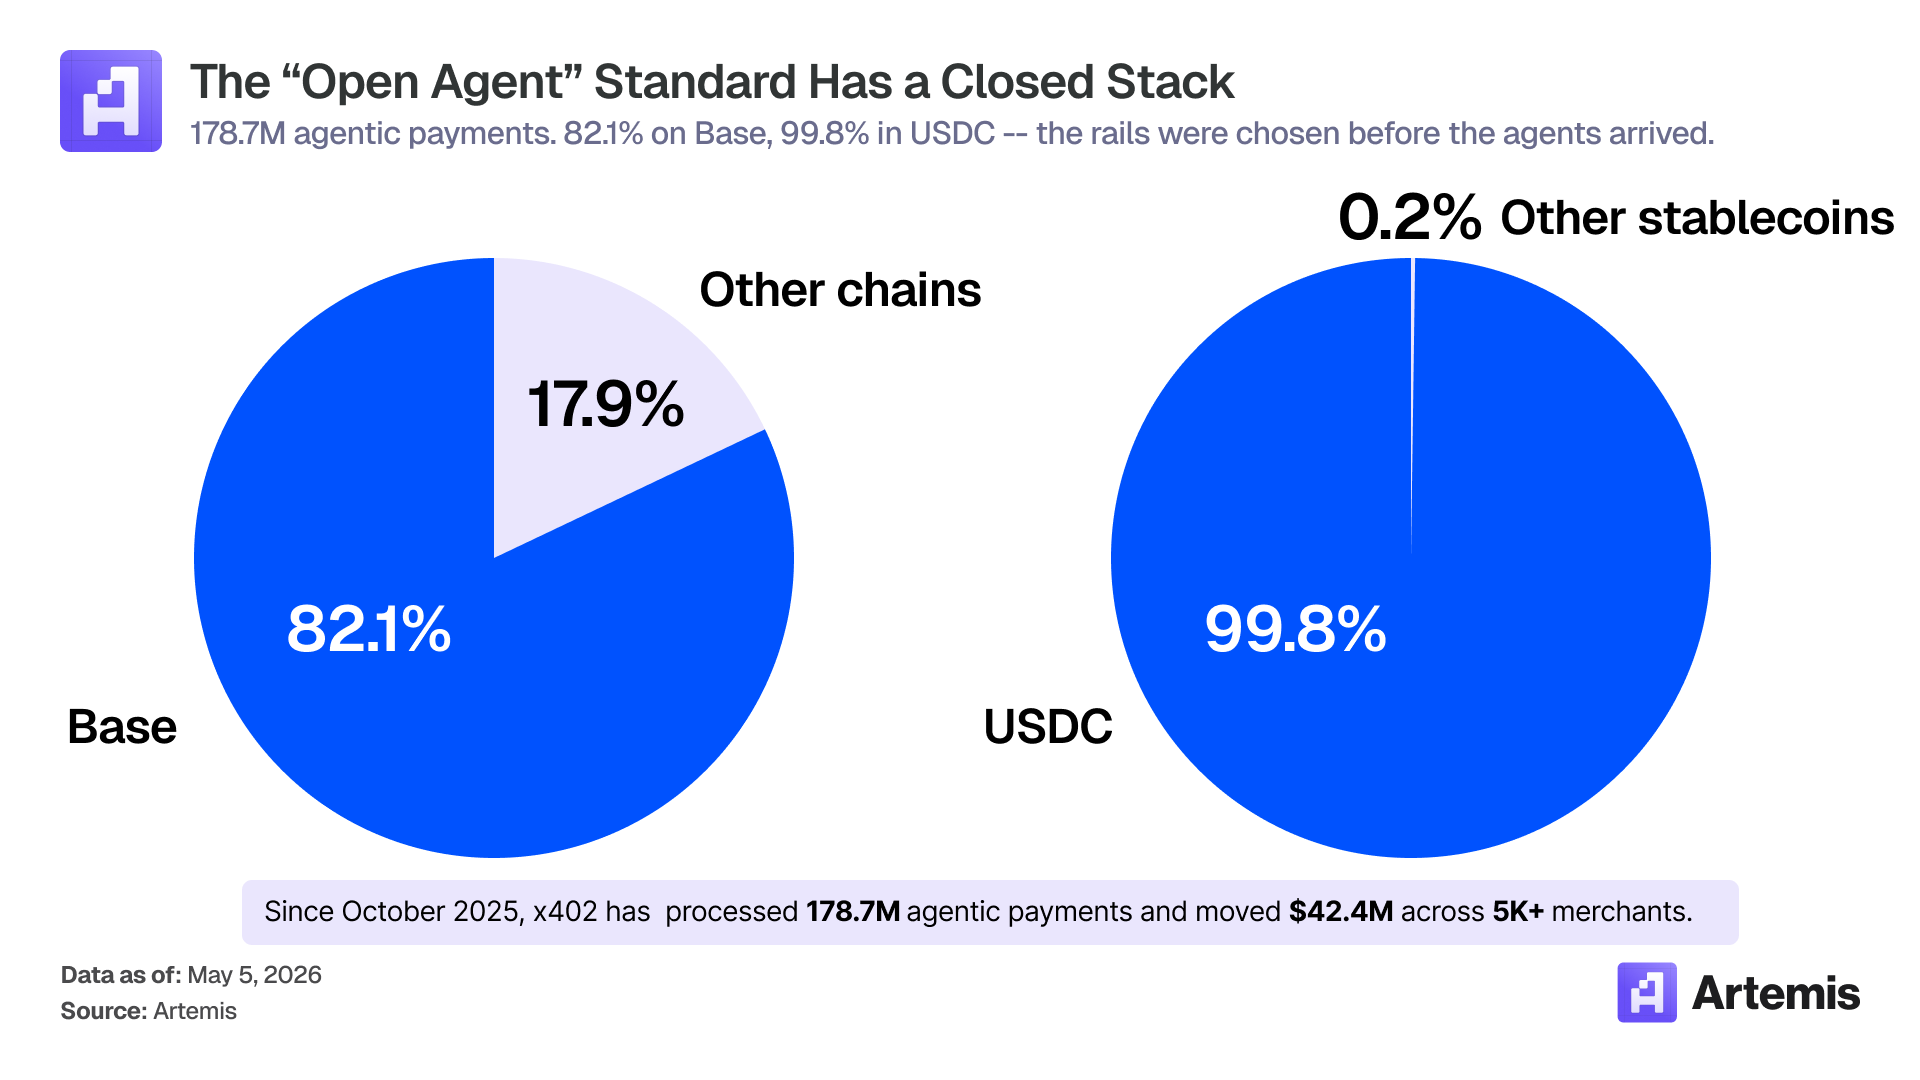
This May 5, 2026 snapshot shows the settlement mix of observed x402 payments: 82.1% on Base and 99.8% in USDC. The original reports 178.7 million payments and $42.4 million transferred across more than 5,000 merchants since October 2025.
What the concentration tells us
An open payment standard can still have concentrated usage. In this snapshot, most of the observed activity uses one chain and one stablecoin. That describes the infrastructure participants used; it does not mean the protocol requires that combination.
The original x402 whitepaper describes an HTTP payment flow: a service requests payment with a 402 response, and a client pays to access the resource. It is designed to support different chains and tokens.
Reading the activity figures
Dividing the displayed $42.4 million by 178.7 million payments gives a mean payment of about $0.24. This is an average across the reported totals, not the median purchase or spending per user. Transactions, buyers and merchants measure different things; a payment count alone does not establish how many autonomous agents made useful purchases.
The chart’s percentages should be read as the original settlement-mix figures. The artwork does not specify whether those shares are weighted by transaction count or dollar volume, so they should not be relabelled as either without the underlying dataset.
Source and scope
The original source is Artemis. Its agentic payments dashboard provides current metrics for transactions, volume, buyers and sellers, including separate real and gamed activity measures. Current definitions and coverage may differ from this historical snapshot.
These figures cover the source’s observed x402 activity. They are not a total for all AI-agent commerce or all stablecoin payments.
Related: AI adoption and the difference between reach and depth.
View the original infographic · More writing
Notes reviewed .
© 2026 Zheng Jie Lim. All rights reserved. Image use.